Tutorial: Create a Data Table
This tutorial walks you through creating a Quarterly KPIs Data Table to track key performance indicators across departments. You will learn how to:
- Create a new table
- Define columns with different data types
- Enter row data
- Set up permissions for team access
Prerequisites
- A Widget Builder account with a license that includes Data Tables
- Access to the Widget Builder at app.widgetbuilder.de
Step 1: Navigate to Data Tables
Open the Widget Builder and click Data Tables in the left sidebar. This page shows all your existing tables and lets you create new ones.
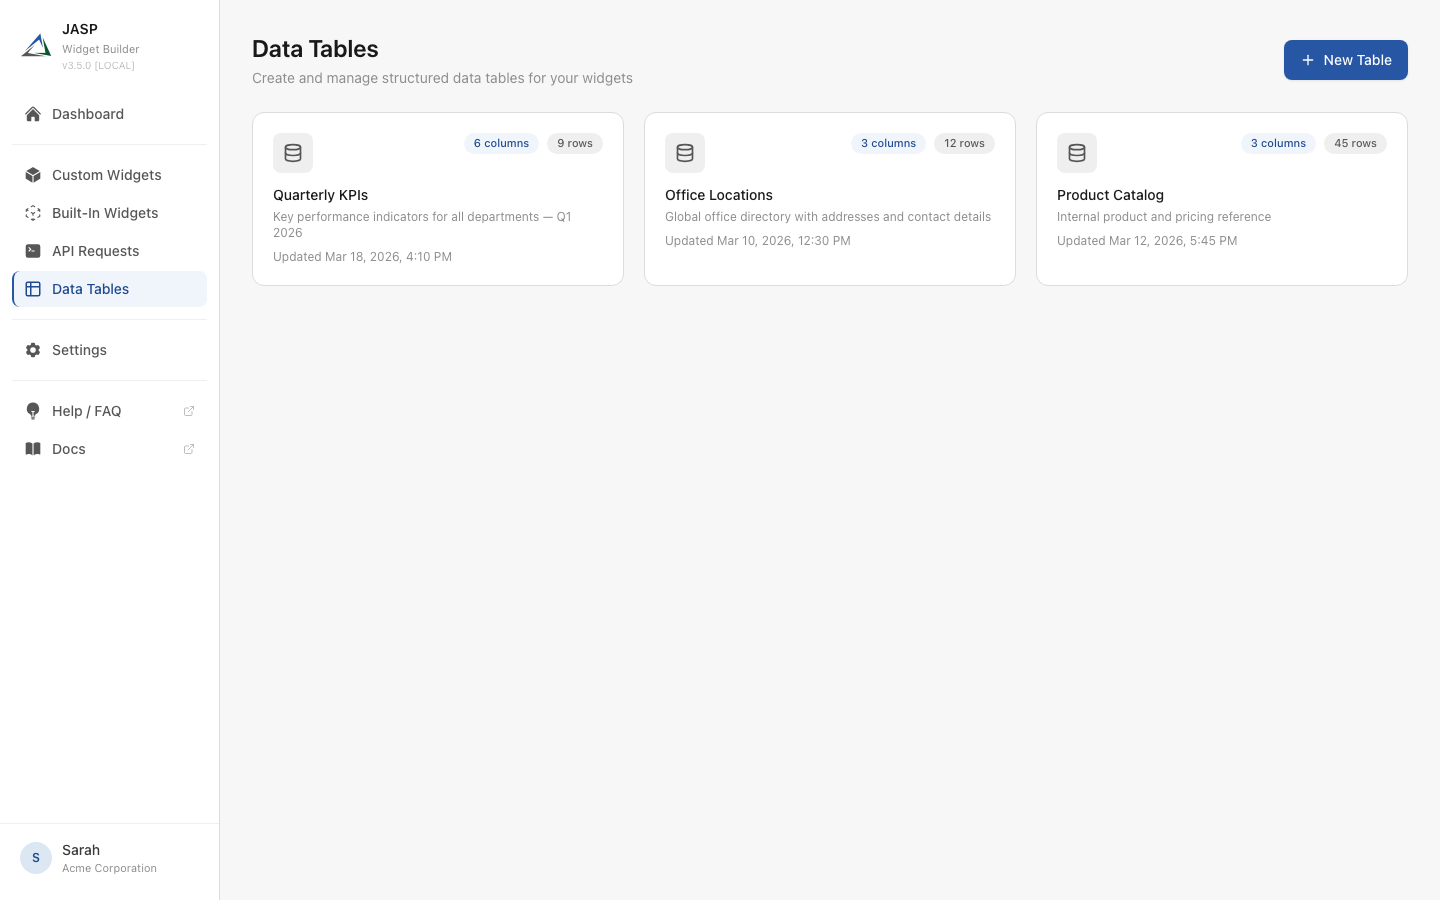
Each table card displays the number of columns, the number of rows, and the last update date.
Step 2: Create a New Table
Click the + New Table button in the top-right corner. A dialog appears where you enter:
- Table Name — A descriptive name for your table (e.g., Quarterly KPIs)
- Description — An optional summary of the table's purpose

Click Create to proceed. You will be redirected to the table detail page.
Table names must be unique within your Widget Builder account. If a table with the same name already exists, you will see an error message.
Step 3: Define Columns
After creating the table, you land on the Columns tab. This is where you define the structure of your data.
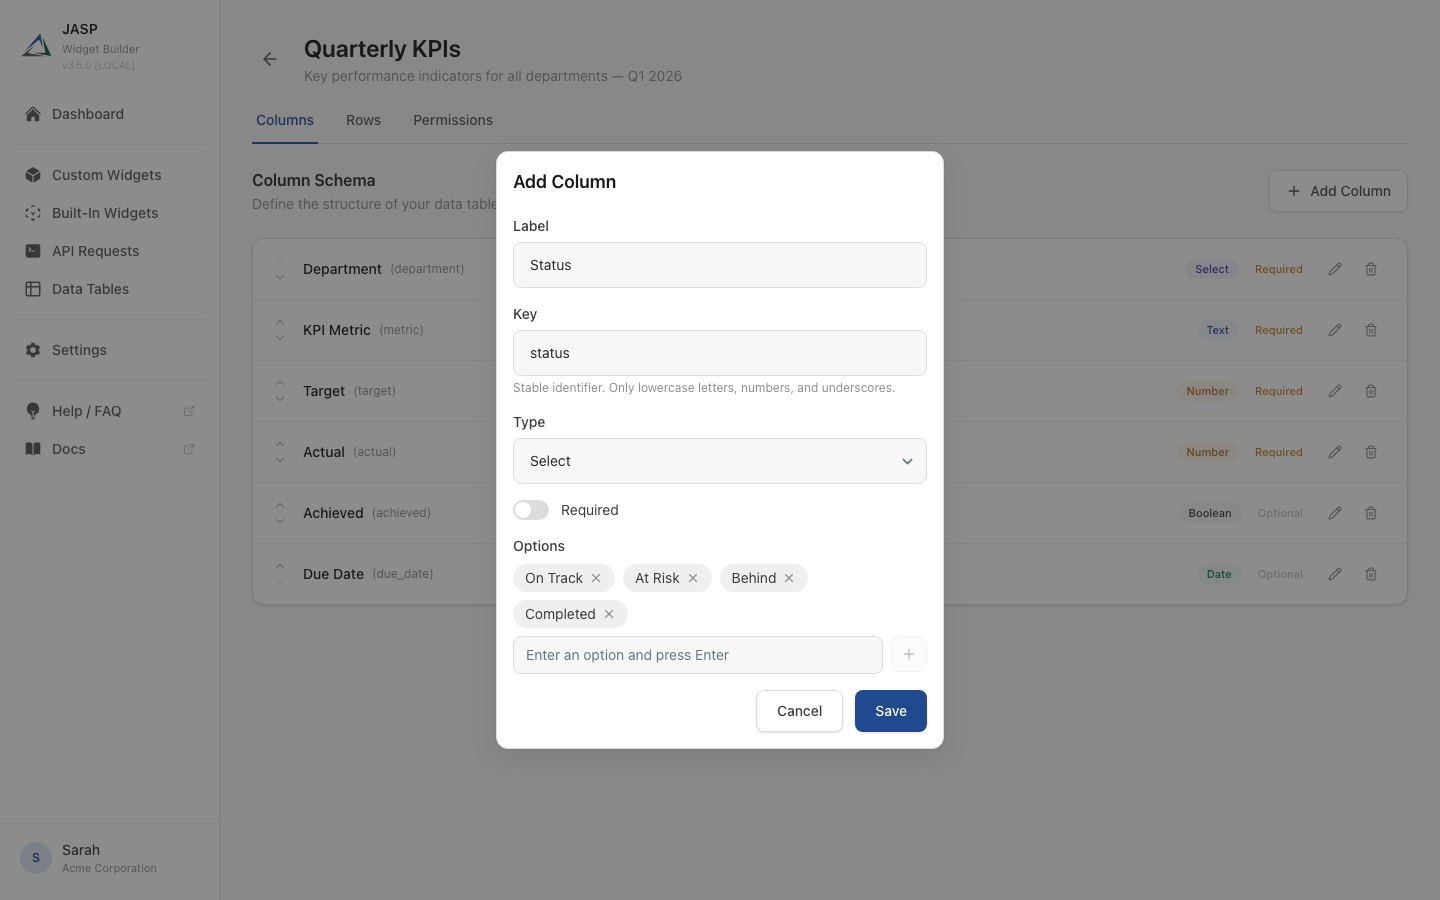
Click + Add Column to open the column editor. For each column, you configure:
- Label — The display name shown in the table header
- Key — A stable identifier used in templates and the API (auto-generated from the label)
- Type — The data type (Text, Number, Date, Select, Boolean, or JSON)
- Required — Whether this field must be filled for every row
Example: KPI Table Columns
For the Quarterly KPIs table, create the following columns:
| Label | Key | Type | Required | Notes |
|---|---|---|---|---|
| Department | department | Select | Yes | Options: Sales, Marketing, Engineering, Support, HR |
| KPI Metric | metric | Text | Yes | Name of the KPI being tracked |
| Target | target | Number | Yes | The target value to achieve |
| Actual | actual | Number | Yes | The actual value achieved |
| Achieved | achieved | Boolean | No | Whether the target was met |
| Due Date | due_date | Date | No | Deadline for the KPI |
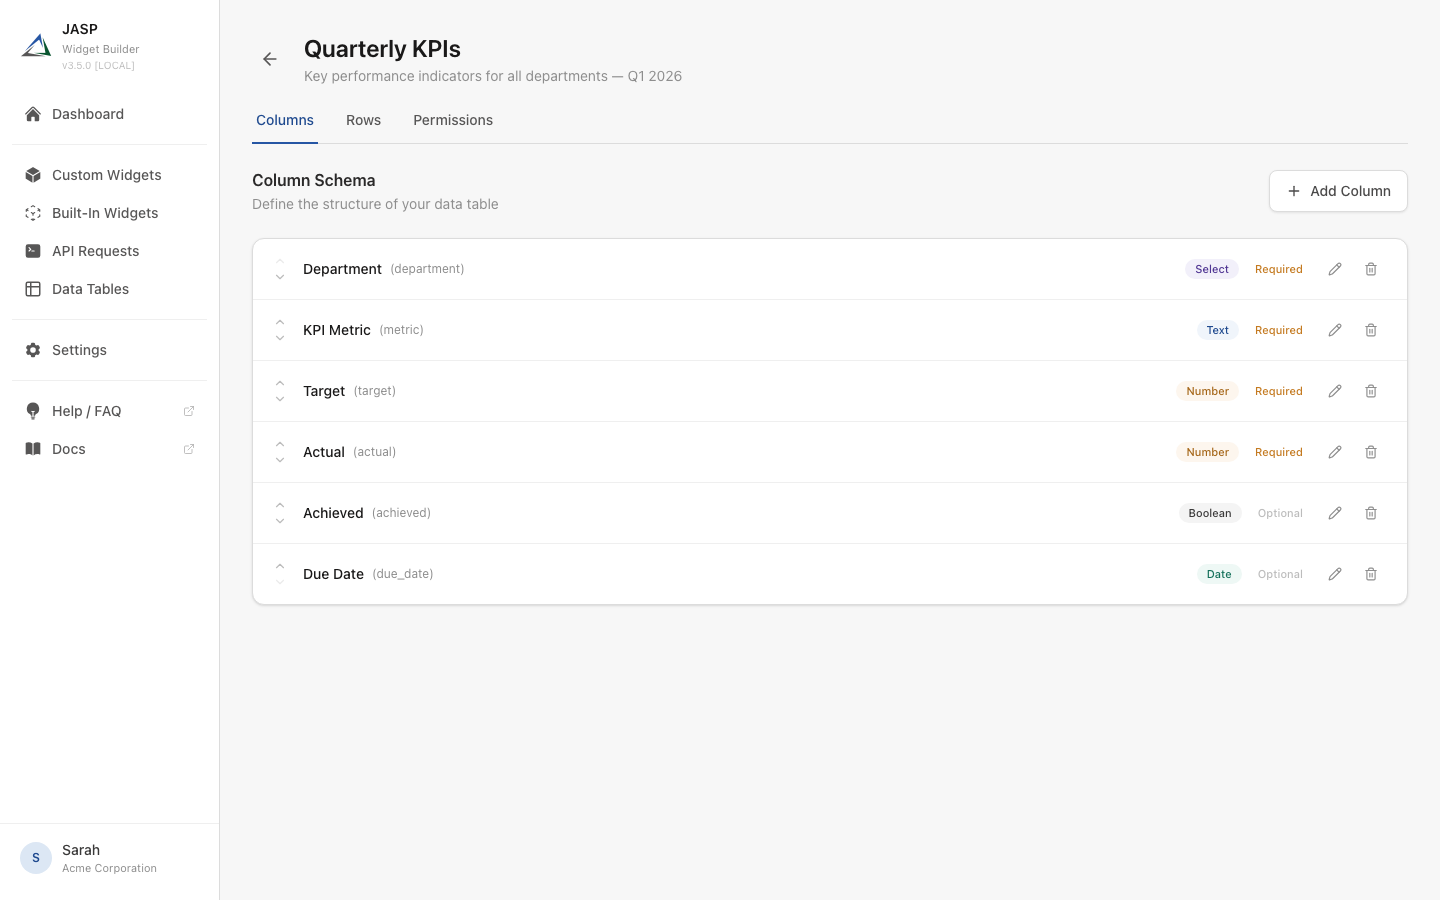
After adding all columns, the Columns tab shows the complete schema with color-coded type badges:
Column Management
- Reorder columns using the up/down arrows on the left
- Edit a column by clicking the pencil icon to change its label, required status, or validation rules
- Delete a column by clicking the trash icon (this removes all data in that column)
The column type cannot be changed after creation. If you need a different type, delete the column and create a new one.
Step 4: Enter Data
Switch to the Rows tab to start adding data. You have two options:
Option A: Add Rows Manually
Click + Add Row to open the row form, or click + Add new row at the bottom of the table to start inline editing. Fill in the values for each column and the row is saved automatically.
Option B: Import from CSV
Click Import CSV to upload a CSV file. The import wizard:
- Automatically maps CSV columns to your table columns using fuzzy name matching
- Lets you manually adjust the column mapping
- Provides an Append mode (adds rows to existing data) or Replace mode (removes existing rows first)
- Validates all data against your column schema before importing
Example Data
Here is the KPI table with sample data entered:

The table supports:
- Sorting — Click any column header to sort ascending or descending
- Filtering — Click + Add filter to filter rows by column values
- Inline editing — Click any cell to edit its value directly
- Pagination — Navigate through pages for large datasets
Step 5: Set Up Permissions
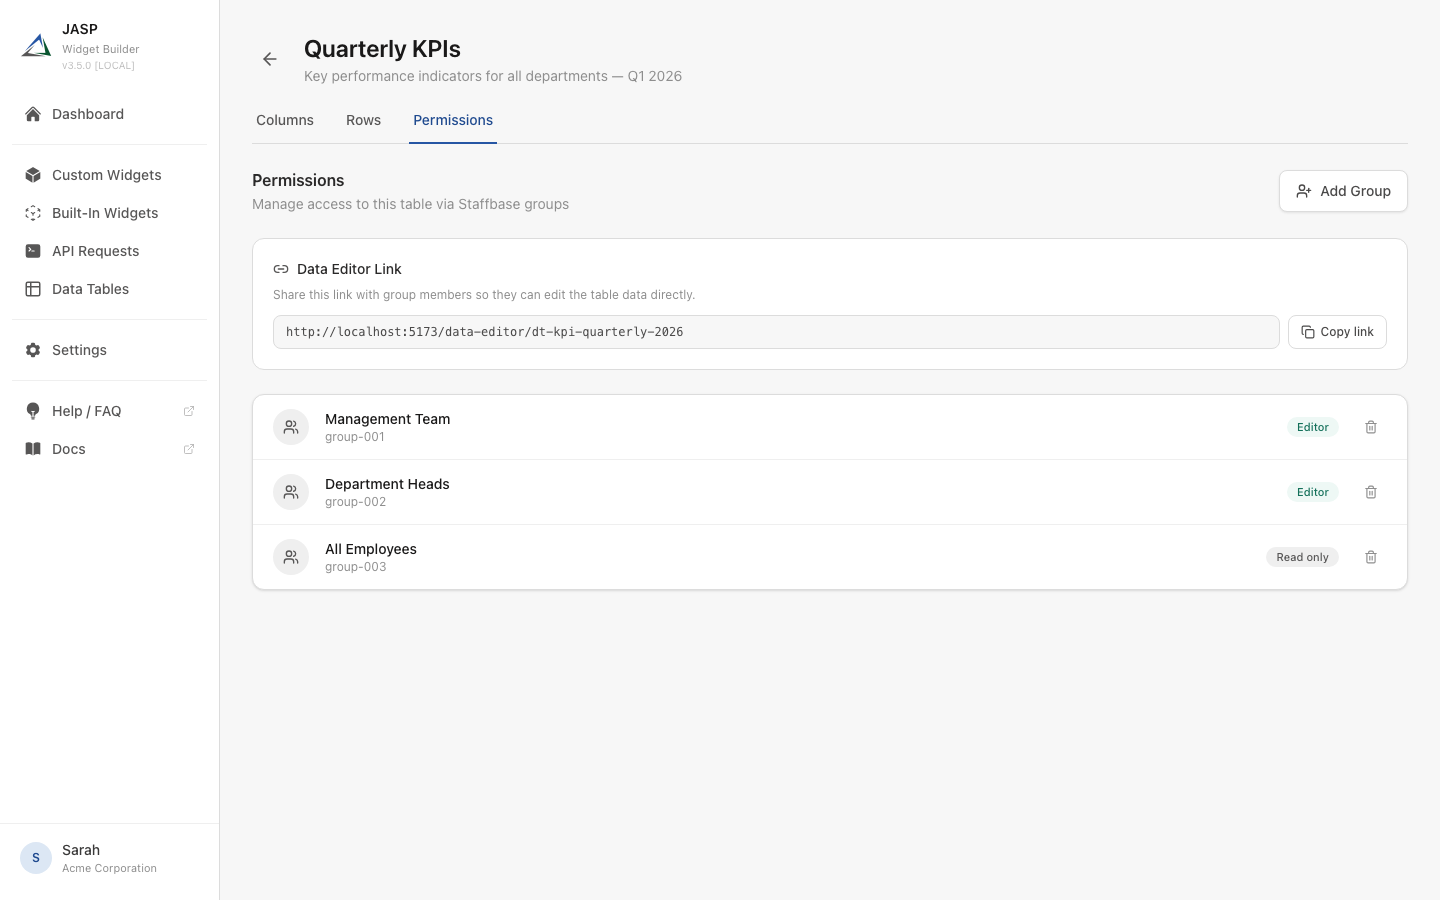
Switch to the Permissions tab to share the table with Staffbase groups. This enables team members to view or edit the data.
Adding a Group
- Click + Add Group
- Search for a Staffbase group by name
- Choose the permission level:
- Editor — Can add, edit, and delete rows
- Read only — Can only view the data
Data Editor Link
The Permissions tab also shows a Data Editor Link. Share this URL with group members so they can access the Data Editor — a simplified interface for editing table data without access to column definitions or widget configuration.
Step 6: Use the Data Table in a Widget
Now that your table has data, you can use it in a custom widget:
- Open or create a Custom Widget
- Go to the API tab in the widget editor
- Select your Data Table as the data source
- Switch to the Layout tab and use Handlebars to render the data
Example Layout
This template renders a styled table with all KPI data from your Data Table, including a green checkmark or red cross for the achievement status.
Summary
You have successfully:
- Created a Data Table with a defined column schema
- Added KPI data manually (or via CSV import)
- Shared the table with Staffbase groups using Editor and Read only permissions
- Connected the Data Table to a custom widget for display on your Staffbase platform
For more details on each feature, see the Data Tables overview.